
July Edition
Clean Accurate Data
Hi there!
What will you need your data to tell you in the next year? And how long do you want to spend trying to compile it? All of your data entered during your rounds and inspections becomes the foundation for almost everything else.
This data:
flow runtimes
lab results
flow rates
chemical dosage
chemical inventories
runtimes
Turns into:
reports
quarterly summaries
annual reporting
permit calculations
asset planning
treatment optimization
You have got a great start!! What more can you do with your accurate, clean data? It’s so satisfying when data lines up and is consistent; downstream problems get solved faster. Your current tools can help!
Thanks for reading!!
Take Care,
Audi (Your Customer Success Champion)
P.S. Do you have questions? I’d love to help!

Hang Out with Waterly & LEARN: Office Hours with Audi
July 14 - 1:00 PM CT to 2:00 PM CT

Your data started here…

Now maybe your data looks like this…

We want your data to look like this!

👆👆You can also check out ALL of our help docs whenever you'd like.

Clean Data Makes Everything Easier
Most reporting problems do not start at the end of the month.
They usually start much earlier, with a missing entry, a fat-fingered meter reading, a skipped test result, or a wonky value from a bad sensor. That is why accurate daily data matters so much. It gives operators, supervisors, administrators, and regulators the same foundation to work from.
Clean data helps answer simple but important questions:
Was the data entered every day it was needed?
Was it entered in the right place?
Can I build accurate reports and make accurate decisions from the entries?
Does the result match how the permit or requirement defines the calculation?
The goal is not always more data entry. The goal is more value in the right data already being entered.
New Calculations = Compliance
It's an interesting perspective to sit at the nexus of so many water companies and states and the regulatory and customer reporting needs including calculations. To be honest, not everyone does it the same. Some states and customers insist on very unique and specific calculations that, frankly, we don't see anywhere else. We produce these compliance calculations because these are what teams need to ensure they're meeting all the state requirements. Let’s review a few new compliance calculations.
Trailing 7-day rolling median
Some California Title 22 recycled water requirements use a specific compliance metric: the trailing 7-day rolling median of sample results, where exceeding a median limit (often 23) can count as a violation. Waterly supports the trailing 7-day rolling median using the report day plus the prior six days. Median is less skewed by one odd sample than an average, and it stays closer to how the permit is written.
Worth checking: does your permit say “median” or “average”?
Quarterly Average and Quarterly Daily Max
Some DMR-style reporting asks for a quarterly average and a quarterly daily maximum. Waterly supports both, using the results from the calendar quarter.
Calendar-bounded 7-day values
We ran into a requirement in Michigan that defines rolling 7-day calculations within the reporting month: first calculation on day 7, then rolling forward daily through month end. We support this calendar-bounded approach, including a rolling 7-day calendar average and a rolling 7-day geometric mean when permits call for it.
Worth Checking: “any 7 consecutive days in a reporting month”
12-month rolling average
Some permits define this as the current monthly average plus the prior 11 monthly averages, divided by 12. That is not always the same as a trailing 365-day average.
Worth checking: are you averaging monthly averages or daily results?
If you need these calculations for your permit, drop us an email at support@waterly.com and let’s get you fixed up for better compliance.
New Branding, Same Great Waterly
We updated our look to better match our focus: staying on the leading edge of keeping smart water simple. We're the same company, with strong values, deep experience, and strong core values for water professionals. A clearer visual signal that we’re here to make compliance and operations simpler, and to back the companies and communities behind the systems. Can you see the water drop? It’s still there!

AI and Your Data:
Should They Work Together?
AI is showing up in more conversations across water and wastewater.
The practical questions underneath are not new:
Can we trust the data?
Will this create more cleanup work?
What information should stay protected?
No tool can replace the system knowledge operators carry every day. The old adage, “Junk in-Junk out” applies even more here as AI can amplify inconsistent and bad data into poor advice. Clean data still beats clever tools.
That applies to all types of sensitive operational data. On June 4th WaterISAC and AWWA issued an advisory encouraging utilities to safeguard sensitive operational information after public records requests from AI service providers sought SCADA logs and historian-style process data. Read their guidance by clicking the link below.
More context: WaterISAC advisory on safeguarding sensitive operational information

In the Field:
Asset Risk Also Starts with Clean Data
Asset planning depends on the same foundation: clean, reliable information.
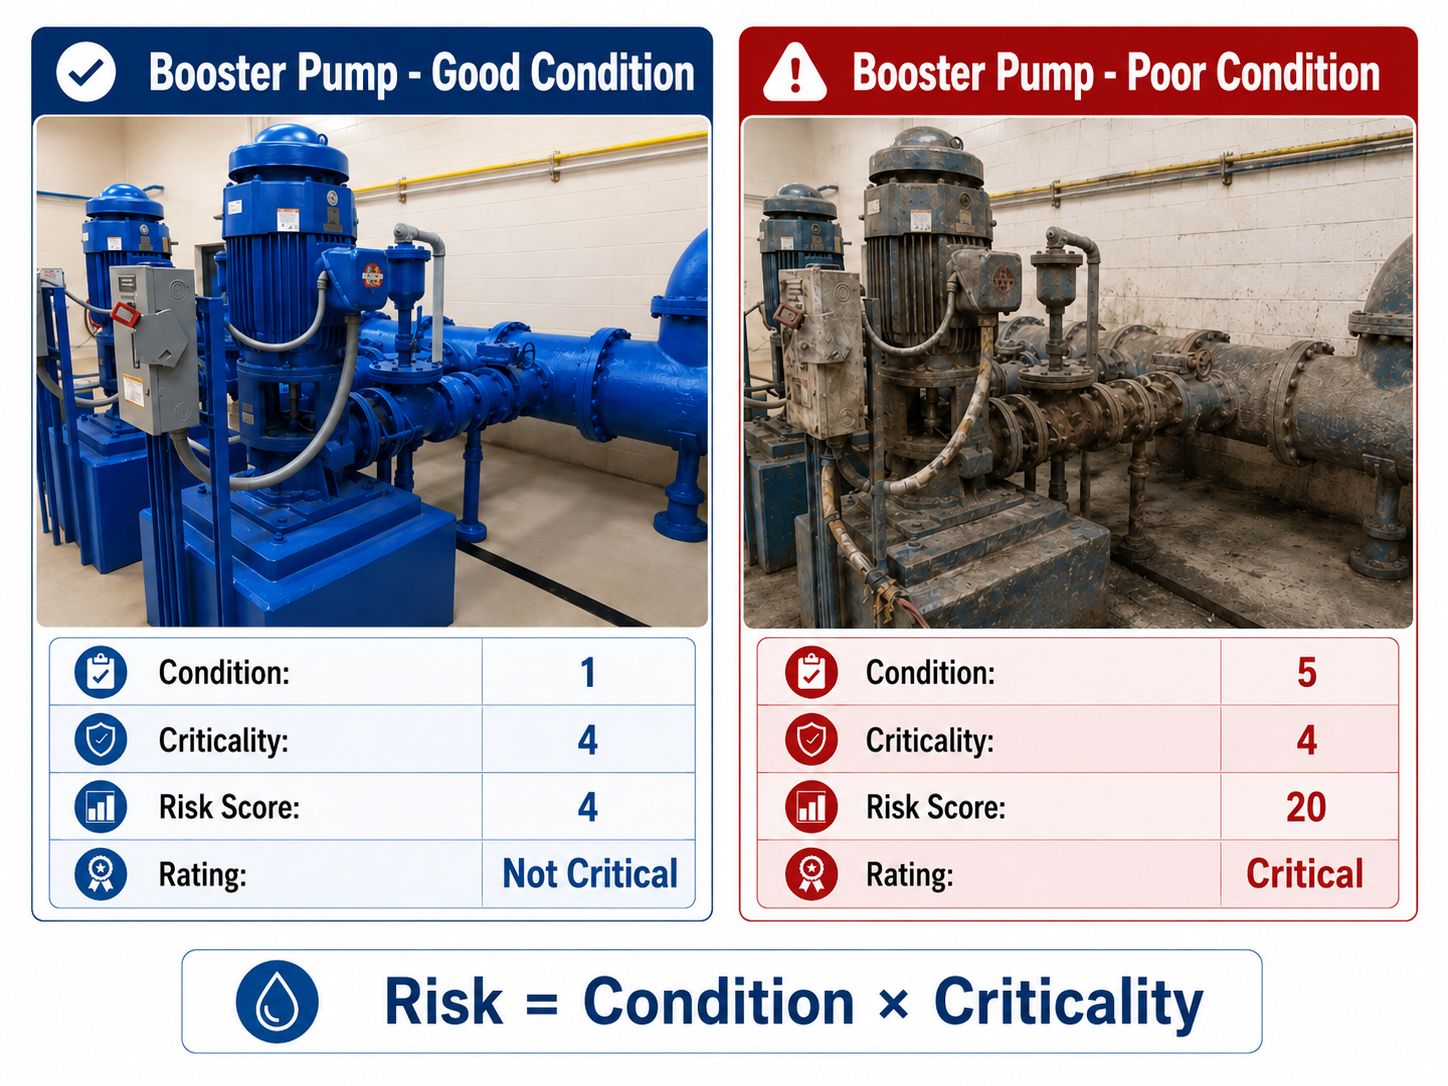
A simple way to start is by scoring two things your team already thinks about:
Condition: how likely the asset is to fail
Criticality: how serious the impact would be if it failed
Indiana Finance Authority SRF guidance uses a straightforward method: score each from 1 to 5, then multiply them to get a risk score.
More context: Indiana Finance Authority SRF asset management guidance
Suggested ranges from the Indiana guidance:
Risk Score:
1 to 8
9 to 16
Greater than 16
Suggested Rating:
Not considered critical
Important, but not critical
Critical
Sneak Peek:
Annual, Quarterly, and Flexible Reporting
Waterly has expanded our native reporting!
This will be the focus of our next Waterly & LEARN session: how to set up annual and quarterly reports, including more flexible ways to organize and review the information your team is already entering.
The goal is simple: fewer one-off spreadsheets, clearer reporting structure, and better use of the data you already trust.